Breathe 

Mission Statement
Information about the air people breathe every day should be accurate, immediate, and verifiable.
BreatheOSS was built in response to a clear gap between reported air quality and lived reality. In a region where people depend heavily on official AQI data, that data must reflect actual exposure, including short-term spikes and inconsistencies. We aim to provide ground-level, real-time measurements that remain transparent at every stage, ensuring that what is shown corresponds to what people are truly breathing.
Available On
Breathe is a multi-platform ecosystem. All clients share the same backend API and display real-time data from the same ground sensor network.
Kotlin + Jetpack Compose. Material You dynamic theming, AMOLED dark mode, home screen widgets. Android 8.1+. Alternatively, you can get the APK directly from our GitHub.
Swift + SwiftUI. Fluid animations, map overlay, 24-hour graph, home screen widgets. Works on iPhone, iPad and Mac
TypeScript + Leaflet. Responsive, light & dark themes, interactive map, weather-tagged AQI history.
Python + discord.py. Slash commands, fuzzy location matching, 24-hour trend graphs, cigarette equivalence.
The Problem
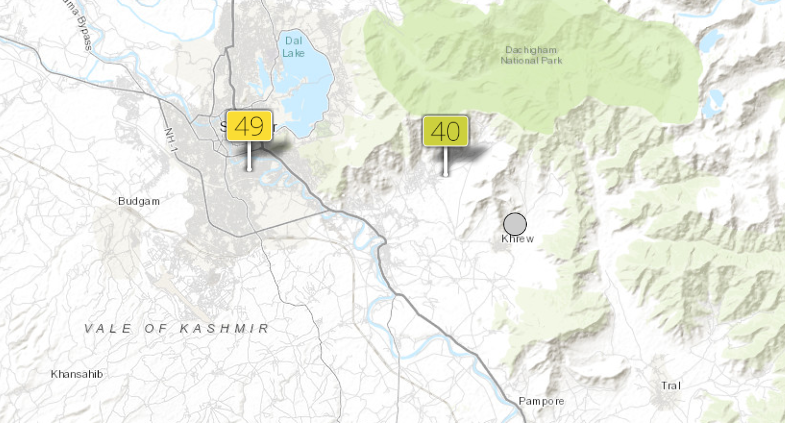
Publicly available AQI data for Jammu, Kashmir and Ladakh is, at best, unreliable. The region has very few government-operated reference stations. Other platforms fill the gap with satellite estimates or interpolated models, but without ground-level validation, those numbers are difficult to trust. None of this data is open, and very little of it is explained.
Our Approach
We believe in ground truth. Our network uses a hybrid approach: official AirGradient kits which are safe, verifiable and accurate while maintaining rigorous, open standards. Where we lack ground coverage, satellite modeling (CAMS) fills in the gaps for regional trends.
Official kits + India-assembled DIY open-hardware, validated against reference instruments.
Regional trends via CAMS modeling via Open-Meteo, used for areas without ground sensors.
How We Calculate AQI
AQI is not a raw sensor reading, it is a standardised index computed from multiple pollutant concentrations. Here is precisely how we do it.
Ground sensors (AirGradient) are prioritised. If a sensor is offline, reporting stale data, or an unrealistic spike is detected, the system automatically falls back to satellite modelling (Open-Meteo / CAMS) for that zone.
When a city has multiple nodes, their readings are averaged before the AQI formula is applied. Erratic nodes are flagged and excluded via a grace-period mechanism.
Each pollutant (PM₂.₅, PM₁₀, NO₂, SO₂, CO, O₃) is converted to its own sub-index using the official breakpoint formula shared by both US EPA and CPCB: I = [(I_hi − I_lo) / (C_hi − C_lo)] × (C − C_lo) + I_lo, evaluated against each standard's respective breakpoint table. Values are capped at 500.
AQI is the maximum sub-index, not an average. The pollutant that drives this highest value is surfaced as the "main pollutant." Both Indian NAQI and US EPA AQI are computed and returned.
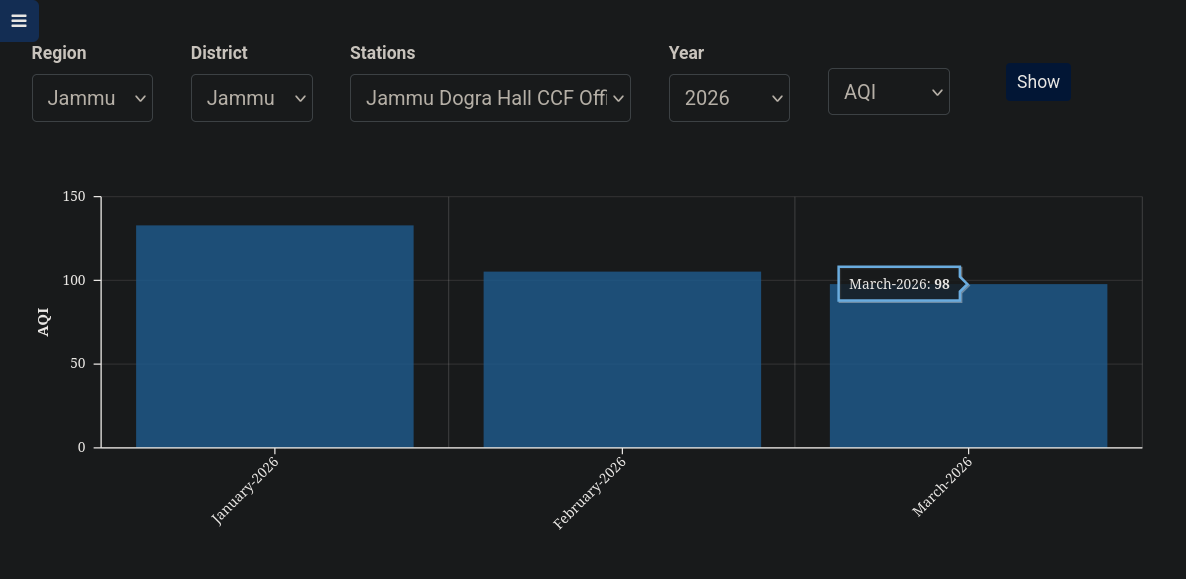
Live AQI is computed from instantaneous sensor readings for spike tracking. A separate 24-hour rolling average AQI is computed per CPCB/EPA regulation for official reporting. Both are returned in every API response. Along with Saved Historical Data.
Network Coverage
We currently track 25 zones across Jammu, Kashmir, and Ladakh. 10 cities have physical ground sensors deployed; the remaining 15 receive satellite-modelled data from Open-Meteo CAMS.
We are actively expanding the sensor network. Contact us if you can host a node in a zone that lacks ground coverage.
Help Expand the Network
The biggest limitation of this project is that we cannot deploy ground sensors everywhere. If you have a stable power source and internet connection. At home, in a shop, on a rooftop: you can host an AirGradient sensor node and contribute real data to the region's air quality record.
Philosophy
Open source is not just a licensing decision for us. The code is open so anyone can audit what we claim. The methodology is documented so anyone can challenge it. The data is free so anyone can use it. We think that is how it should be, and believe that should never be changed. Open-source is fundamentally about dismantling artificial boundaries and democratizing access to truth. In a country as vast and structurally complex as India, decentralized and transparent systems are the most logical counter to infrastructural opacity. This project grounds its philosophy in the same critical observation that defined much of Pink Floyd's work: a rejection of isolation and a demand to examine the systems built around us.
The Origin & Technical Specifications
To read more about the origin, story, and technical specifications behind Breathe, check out our deep-dive blog post on how we built it from the ground up.
Read the Blog Post